Some weeks ago, when I was doing another audio recording, I asked myself if there is an optimal gain setting for the input of the audio interface and what it might be. In general, we can adjust the input gain to any value and amplify or attenuate the signal later in the post processing. However, we all know that low gain settings destroy our recordings as they contain too much noise which is basically impossible to reduce afterwards. So the optimum I am looking for means an optimal trade-off between high gain and low noise as any amplifier also contributes and increases noise.
Measurement Setup
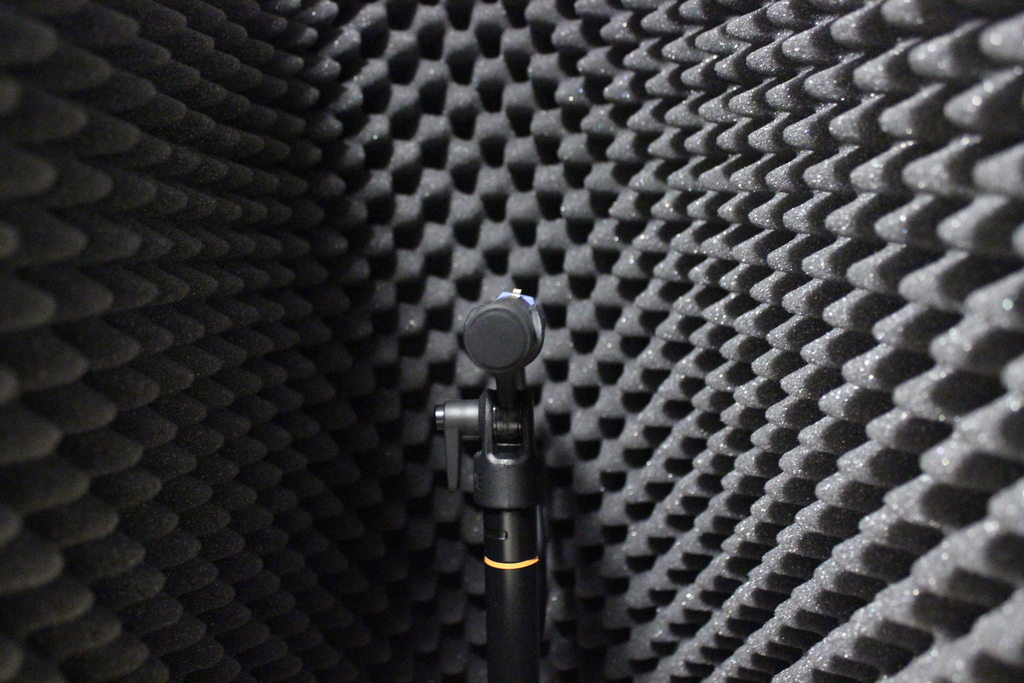
For the investigation of the gain settings a simple measurement setup was used consisting of a loudspeaker that is placed opposite of a microphone of type Rode M5. The loudspeaker was connected to a test tone generator and the microphone to different audio interfaces. The microphone was partially covered with an acoustic absorber to reduce external noise that could distract the measurement. However, in fact, almost no external noise was present and the recordings were repeated accordingly to ensure that the measurement data are valid. The tone generator was set to produce C4 (261.63 Hz). The whole arrangement and all settings were kept constant during the measurements and only the power of the loudspeaker was switched on and off. For each audio interface and each gain setting, recordings were made with and without the test tone. Pictures of the setup are shown in Figs. 1 to 3.


Audio Interfaces
In total, five different audio interfaces from four manufacturers were compared. They are shown in Fig. 4 while Table 1 lists the most important characteristics. All interfaces have a dynamic range greater than 106 dB and a maximum gain of 50 dB.

Table 1: Overview of the most important specifications of the compared interfaces
| Interface | Dynamic Range | Gain | max. Input Level (Mic) |
|---|---|---|---|
| Behringer UMC204HD | 110 dBA | / | -4 dBu |
| Behringer UMC1820 | 106 dBA | / | +11 dBu |
| Lexicon Omega Studio | 118 dBA | 50 dB | +18 dBu |
| Presonus Studio24c | 106 dB | 50 dB | +10 dBu |
| Steinberg UR824 | 106 dBA | 60 dB | / |
Measurements
For each of the audio interfaces, recordings have been made with different gain settings, i.e. the gain was set to values between 0 % and 100 %. However, exact gain settings depend on the individual gain knobs and cannot be defined across different interfaces. Therefore, a reference measurement with a test tone was included to enable a comparison of the different audio interfaces. The input levels for different gain settings are depicted in Fig. 5. The solid lines represent the levels with and the dashed lines without the test tone where the latter is therefore only noise. Fig. 5 shows that the maximum and minimum gain is different for the different interfaces which is also expected from Table 1. Interesting, however, is the fact that the Lexicon Omega Studio is the only interface which fully suppresses the input signal at 0 % gain. Conspicuous is also the fact that the Behringer UMC204HD and UMC1820 are very different in terms of gain settings and noise even if they share the brand and belong to the same product family. An explicit comparison of the maximum level with the test tone and the minimum level without the tone is shown in Fig. 6. The UMC204HD has the highest input gain while it also has the highest noise level at minimum gain and without the tone. Table 2 lists the dynamic ranges of the different audio interfaces which has been calculated from the recorded data as the difference between the maximum gain setting with the tone (red curve) and the minimum gain setting without the tone (blue curve). However, the actual dynamic range is larger than the stated numbers since the interfaces were not leveled to the maxima.
Table 2: Dynamic Ranges of the audio interfaces calculated from the test recordings
| Interface | Dynamic Range |
|---|---|
| Behringer UMC204HD | 73.5 dB |
| Behringer UMC1820 | 76.8 dB |
| Lexicon Omega Studio | 65.3 dB |
| Presonus Studio24c | 81.1 dB |
| Steinberg UR824 | 81.5 dB |
Fig. 6 also shows the noise level with 100 % gain and when the input is open, i.e. no microphone or other audio source is connected. The disconnected noise level is, without exception, lower than for the case when the microphone is connected and no tone is played. This implies that a significant part of the noise originates from the connected microphone. However, this was intended as a realistic recording scenario should be investigated and a connected microphone will always contribute noise. In addition, the signal-to-noise ratio (SNR) has been calculated from Fig. 5 and is depicted over the corresponding gain settings in Fig. 7. In the test, the SNR for the Steinberg UR824 was almost constant with only 2 dB variation over the whole gain range. The SNR drops especially at low gain settings where it is only about 24 dB for the Behringer interfaces. Outstanding is the Lexicon Omega Studio which has an SNR of 0 dB at a gain setting of 0 % as it fully suppresses the sound. Interesting is the fact, that the UMC1820 has a fairly high SNR from 50 % gain setting upwards. The Presonus Studio24c has slightly more variation than the Steinberg interface but does not drop significantly at the lower end. However, it drops about 4 dB at 100 % gain while the absolute noise is even higher than for the UMC1820 at this point which is exceptional as it is always lower elsewhere. At 75 % gain all the interfaces, except for the Omega Studio, share their maximum gain which seems to be the best choice for operation regarding the SNR.


Conclusions
The comparison of the test recordings show that there are significant differences between the audio interfaces in terms of absolute gain and noise level. Further, the investigation reveals that the SNR highly depends on the gain settings. In general, the optimal operating point of an audio interface is where the SNR is maximized. In reality, the dependence of the SNR on the gain of an audio interface is usually not known while the actual operating point also depends on the used microphone or audio source as the input level must be adjusted to prevent clipping. However, the recordings show that almost all of the investigated audio interfaces reach their maximum SNR at 75 % gain. This can be kept in mind while a more detailed investigation might reveal a more exact conclusion. But in the end, the ears decide which settings are best.